
See why top ecommerce brands use Miva’s no-code platform to run
multiple stores, manage massive catalogs, and grow their revenue.
This blog post comes from our partner, Yottaa. Yottaa provides end-to-end acceleration, protection and visibility for modern web applications across the wired and wireless web, delivering speed, scale, security and actionable insight.
These days, web pages make nearly universal use of JavaScript to deliver a richer experience, especially when it comes to eCommerce sites built to meet the needs of online consumers. But have you ever wondered what the impact of those JavaScripts on performance might be?
Well, because Yottaa’s web monitoring service monitors tens of thousands of web sites and has accumulated a database of tens of millions of web performance samples, we have a treasure trove of data. We set out to answer the following questions:
Web performance is often something businesses and website owners take for granted; many times, we assume that our site will run smoothly and efficiently, and when it doesn’t it can be incredibly frustrating.
And the truth is, if your website takes longer than 3 seconds to load, it’s already losing revenue. Every additional second after that represents a 7% loss in conversions, and after 3 seconds 40% of visitors will leave your site.
User expectations are increasing, E-commerce sites need to keep up. Third party JavaScript often allows online retailers to create richer experience with live chat features, social widgets, Google Analytics, and more. With use of these features steadily building in online marketplaces, ensuring good performance is becoming increasingly important.
Now, let’s look at the numbers. With data across millions of samples, we looked specifically at the following metrics:
To identify the worst offenders impacting speed of the web, we developed a “figure of merit” which combines the JavaScript’s popularity with the fraction of time its download took over 1 second. We did this to categorize the JavaScript as such:
Here are some of the results: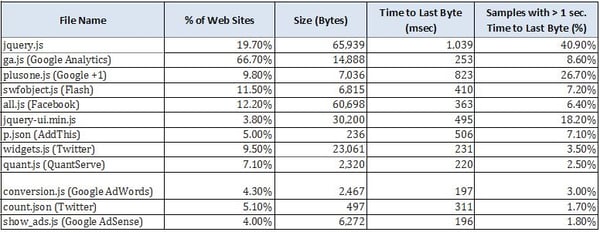
Let’s start by taking a look at the Google Analytics JavaScript, which is used by nearly two thirds of web sites within our sample. It is 15KB in size and takes 0.25 seconds to download on average, with 8.6% of the samples taking longer than 1 second. On the other hand, the Google +1 widget has half the download footprint (7KB), but a much wider spread in performance: nearly a second to download, with over a quarter of the samples taking longer than 1 second.
These metrics allow us to pinpoint the top JavaScripts that are affecting web performance:
How does a JavaScript’s popularity impact performance? Here’s the empirical data for the entire population of JavaScripts we looked at:
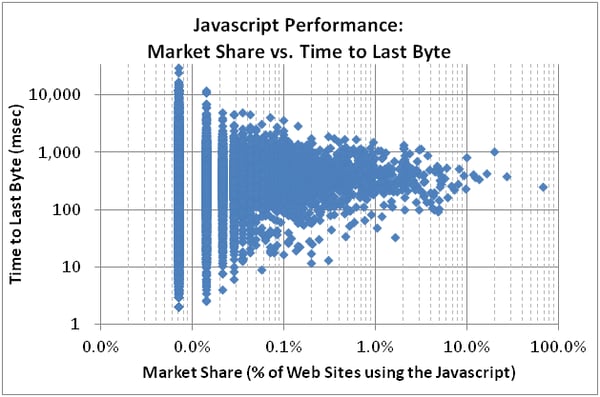
We can see that for the lesser used JavaScripts, there’s a wide spread in performance. On the other hand, for the more popular JavaScripts, the spread in performance drops. Here’s our theory: as JavaScripts become more popular, it is increasingly impactful – and thus important – to have a quick download time, and (as we will see later) web developers turn to techniques like caching copies of the JavaScript around the globe.
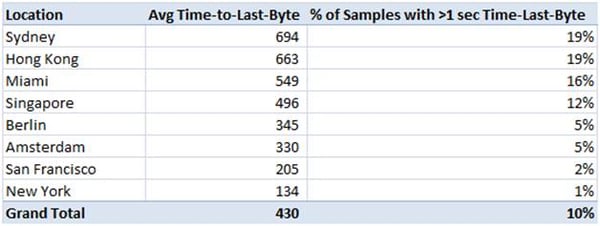
Since Google Analytics is the world’s most popular JavaScript, we thought it’d be interesting track it in eight global cities and see how it performs globally. It’s interesting to note that even the web’s best funded infrastructure has notable challenges: the JavaScript takes one or two tenths of a second to download in San Francisco and New York, and about 98% of the time it downloads within 1 second, whereas in Hong Kong and Sydney it takes three to five times longer, with nearly 20% of the samples taking longer than 1 second.
Here we have a good amount of data on different JavaScripts. But what does this mean when it comes to hosting? Should you host the JavaScript on your servers, or on third party servers?
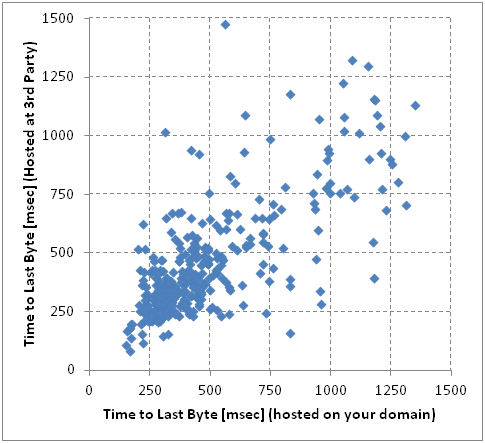
For a fairly large set of JavaScripts, there were samples of it hosted both at the same domain as the rest of the page, and samples of it hosted elsewhere. In the plot below, each point represents a unique JavaScript: the X value corresponds to Time-to-last-Byte when hosted on the same origin server as the rest of the page, whereas the Y value corresponds to the Time-to-Last-Byte when hosted at a third party.
This data suggests that though there’s some variation, there’s not an obvious benefit to hosting it elsewhere, on average. (Let’s emphasize “on average” because there are approaches where third party hosting is beneficial – see next section!)
Knowing the size of the file, server IP address and the download timeline, we can compute the individual server’s bandwidth. And as it turns out, this varies widely – typically a couple hundred kilobytes per second, though (as illustrated in the histogram below) there’s a spike at the high end.
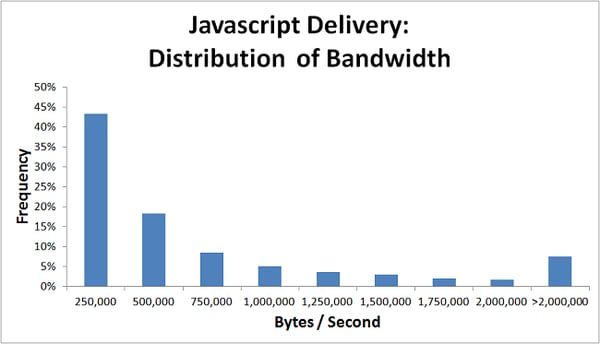
It turns out that a small set of fast IP addresses serve a large volume of the web’s JavaScripts. Of course, we thought it’d be interesting to see whose servers they are. Not too surprisingly, Google and (CDN leader) Akamai dominate the list – delivering files an order of magnitude faster than the rest of the web.

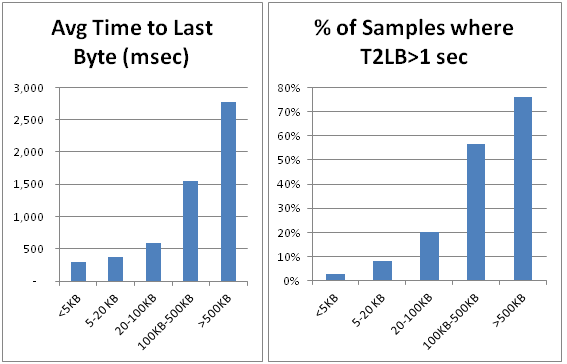
The final part of the analysis was to see what impact the JavaScript’s size has on download time and the percentage of samples above a certain threshold (which we chose as one second)). Keeping with traditional web performance rules, the larger the file, the longer it takes to receive.
Presumably, if you’re using a JavaScript, you actually need it. So, short of eliminating it, what can you do to optimize performance? Here are our three tips:
No worries, download the PDF version now and enjoy your reading later...
Download PDF Miva
Miva
Miva offers a flexible and adaptable ecommerce platform that evolves with businesses and allows them to drive sales, maximize average order value, cut overhead costs, and increase revenue. Miva has been helping businesses realize their ecommerce potential for over 20 years and empowering retail, wholesale, and direct-to-consumer sellers across all industries to transform their business through ecommerce.
Visit Website